SustainabilityESG Data List
Below is the list of ESG (Environmental, Social and Corporate Governance) data on the business activities of the Group.
Environment
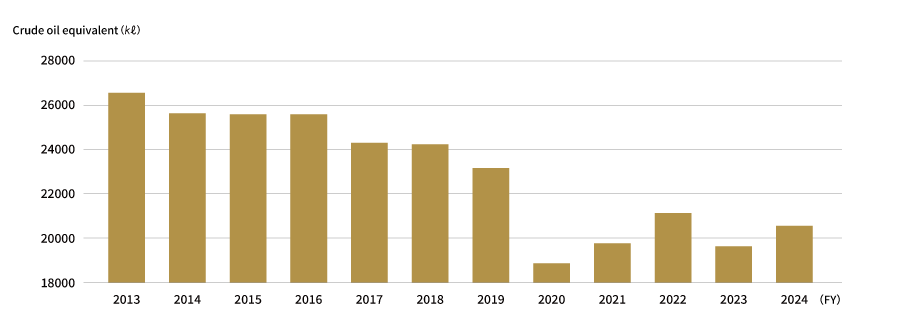
(1) Energy consumption based on the Revised Energy Conservation Act (crude oil equivalent)
| 2013 | 2014 | 2015 | 2016 | 2017 | 2018 | 2019 | 2020 | 2021 | 2022 | 2023 | 2024 | |
|---|---|---|---|---|---|---|---|---|---|---|---|---|
| Energy usage(㎘) | 26,520 | 25,736 | 25,618 | 25,614 | 24,235 | 24,196 | 23,180 | 18,755 | 19,878 | 20,957 | 19,816 | 20,524 |
-
*Total of four business sites (Tokyo, Osaka, Kamikochi, and Kashiwa)
-
*Figures for FY2024 are preliminary.
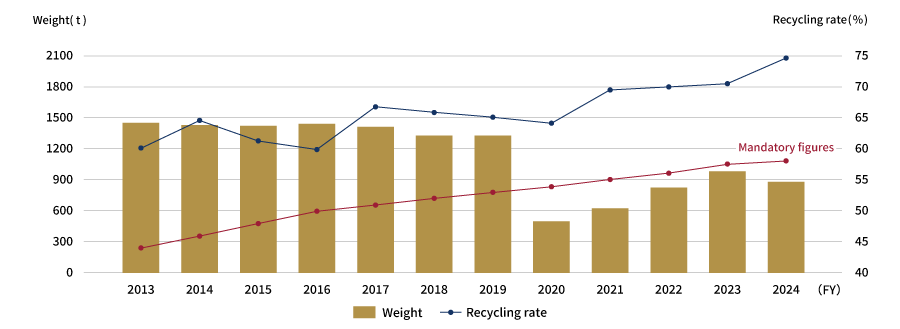
(2) Amount of food waste generated (weight) and recycling rate based on the Food Waste Recycling Law
| 2013 | 2014 | 2015 | 2016 | 2017 | 2018 | 2019 | 2020 | 2021 | 2022 | 2023 | 2024 | |
|---|---|---|---|---|---|---|---|---|---|---|---|---|
| Amount of food waste generated(t) | 1,448.7 | 1,431.2 | 1,428.4 | 1,439.8 | 1,427.2 | 1,371.3 | 1,372.4 | 493.1 | 604.6 | 804.5 | 967.4 | 878.8 |
| Recycling implementation rate(%) | 59.9 | 64.7 | 61.3 | 59.7 | 66.6 | 65.9 | 65.1 | 64.7 | 69.1 | 69.8 | 71.4 | 74.9 |
-
*
-
Total of four business sites (Tokyo, Osaka, Kamikochi, and Kashiwa) / Mandatory figures for FY2024 are 58%.
-
Total of four business sites (Tokyo, Osaka, Kamikochi, and Kashiwa) / Mandatory figures for FY2024 are 58%.
-
*
-
Figures for FY2024 are preliminary.
-
Figures for FY2024 are preliminary.
(3) Specific Greenhouse Gas Emissions [Tokyo]
| 2013 | 2014 | 2015 | 2016 | 2017 | 2018 | 2019 | 2020 | 2021 | 2022 | 2023 | 2024 | |
|---|---|---|---|---|---|---|---|---|---|---|---|---|
| Emissions(t) | 29,396 | 28,559 | 32,066 | 31,800 | 29,349 | 29,420 | 28,749 | 23,286 | 25,241 | 26,965 | 26,479 | 23,452 |
| Emissions against standards(%) | ▲13.8 | ▲16.3 | ▲19.9 | ▲20.5 | ▲26.7 | ▲26.4 | ▲28.2 | ▲41.8 | ▲36.9 | ▲32.6 | ▲33.8 | ▲41.4 |
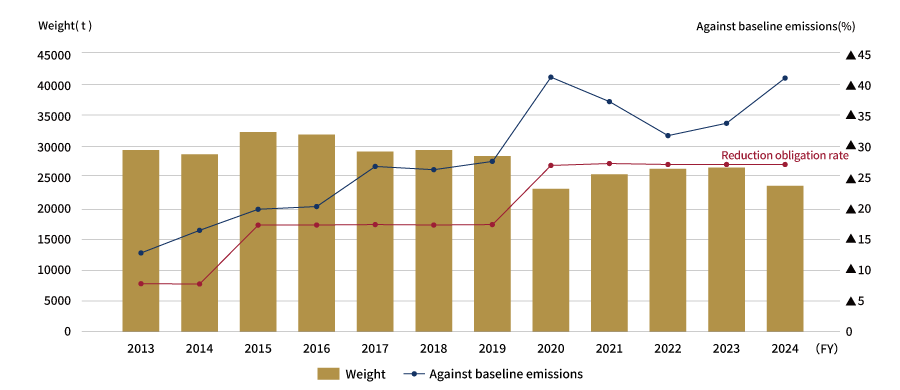
[Global warming countermeasures plan based on the Tokyo Metropolitan Ordinance on Environmental Security] Between FY2002 and FY2007, we set the average value for the three years between FY2002 and FY2004 as the base emissions.
-
*1Reduction obligation rate: 8.0% until FY2014 (Base year emissions: 34,113 tons)
-
*2From FY2015, reduction obligation rate is 17.0% (Base year emissions are 40,017 tons due to changes in emission factors)
-
*3From FY2020, reduction obligation rate is 27.0% (Base year emissions are 40,017 tons)
-
*4Figures for FY2024 are preliminary.
Diversity Promotion
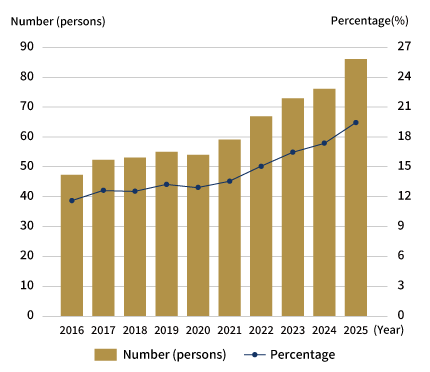
(1) Number of female managers
| 2016 | 2017 | 2018 | 2019 | 2020 | 2021 | 2022 | 2023 | 2024 | 2025 | |
|---|---|---|---|---|---|---|---|---|---|---|
| Number of female managers | 47 | 52 | 53 | 55 | 54 | 59 | 67 | 73 | 77 | 86 |
| Ratio(%) | 11.8 | 12.7 | 12.6 | 13.1 | 12.8 | 13.5 | 15.1 | 16.4 | 17.3 | 19.4 |
-
*Target value of the Action Plan for Women's Advancement Promotion as of April 1 each year: 20% by the end of April 2027
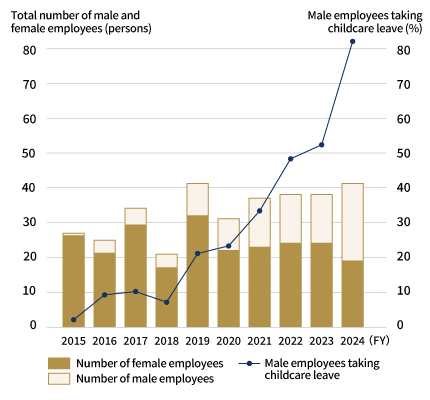
(2) Number of employees on childcare leave
| 2015 | 2016 | 2017 | 2018 | 2019 | 2020 | 2021 | 2022 | 2023 | 2024 | |
|---|---|---|---|---|---|---|---|---|---|---|
| Total of men and women | 27 | 25 | 34 | 21 | 41 | 31 | 37 | 38 | 38 | 41 |
| Number of women | 26 | 21 | 29 | 17 | 32 | 22 | 23 | 24 | 24 | 22 |
| Number of men | 1 | 4 | 5 | 4 | 9 | 9 | 14 | 14 | 14 | 19 |
| Male acquisition rate(%) | 2 | 9 | 10 | 7 | 20.9 | 23.1 | 33.3 | 48.3 | 53.8 | 82.6 |
-
*The rate of female employees taking childcare leave is 100% from FY2015 through FY2024.
-
*The target rate for male employees is 75% by the end of April 2027